Workload Group Best Practice
Test hard memory limit
Ad-hoc queries typically have unpredictable SQL input and uncertain memory usage, which carries the risk of a few queries consuming a large amount of memory. This type of load can be assigned to a separate group. By using the hard memory limits feature of the Workload Group, sudden large queries can be prevented from consuming all available memory, which would otherwise leave no memory for other queries or cause an Out of Memory (OOM) error.
When the memory usage of this Workload Group exceeds the configured hard limit, memory will be freed by killing queries, thus preventing the process memory from being completely consumed.
Test env
1FE,1BE,BE(96 cores),memory is 375G。
Test data is clickbench, run q29 in 3 concurrent.
Not using Workload Group's memory limit.
- Show process memory usage, ps shows memory usage, the memory is 7.7G.
[ ~]$ ps -eo pid,comm,%mem,rss | grep 1407481
1407481 doris_be         2.0 7896792
[ ~]$ ps -eo pid,comm,%mem,rss | grep 1407481
1407481 doris_be         2.0 7929692
[ ~]$ ps -eo pid,comm,%mem,rss | grep 1407481
1407481 doris_be         2.0 8101232
- Show Workload Group memory by system table, it's 5.8G.
mysql [information_schema]>select MEMORY_USAGE_BYTES / 1024/ 1024 as wg_mem_used_mb from workload_group_resource_usage where workload_group_id=11201;
+-------------------+
| wg_mem_used_mb    |
+-------------------+
| 5797.524360656738 |
+-------------------+
1 row in set (0.01 sec)

mysql [information_schema]>select MEMORY_USAGE_BYTES / 1024/ 1024 as wg_mem_used_mb from workload_group_resource_usage where workload_group_id=11201;
+-------------------+
| wg_mem_used_mb    |
+-------------------+
| 5840.246627807617 |
+-------------------+
1 row in set (0.02 sec)

mysql [information_schema]>select MEMORY_USAGE_BYTES / 1024/ 1024 as wg_mem_used_mb from workload_group_resource_usage where workload_group_id=11201;
+-------------------+
| wg_mem_used_mb    |
+-------------------+
| 5878.394917488098 |
+-------------------+
1 row in set (0.02 sec)
Here, you can see that the memory usage of the process is usually much greater than the memory usage of a single Workload Group, even if only one Workload Group is running in the process. This is because the Workload Group only accounts for the memory used by queries and some parts of data import. Other components within the process, such as metadata and various caches, are not included in the Workload Group's memory usage and are not managed by the Workload Group.
Use Workload Group limit memory
- Alter workload group.
alter workload group g2 properties('memory_limit'='0.5%');
alter workload group g2 properties('enable_memory_overcommit'='false');
- Run test, the workload group uses 1.5G memory.
mysql [information_schema]>select MEMORY_USAGE_BYTES / 1024/ 1024 as wg_mem_used_mb from workload_group_resource_usage where workload_group_id=11201;
+--------------------+
| wg_mem_used_mb     |
+--------------------+
| 1575.3877239227295 |
+--------------------+
1 row in set (0.02 sec)

mysql [information_schema]>select MEMORY_USAGE_BYTES / 1024/ 1024 as wg_mem_used_mb from workload_group_resource_usage where workload_group_id=11201;
+------------------+
| wg_mem_used_mb   |
+------------------+
| 1668.77405834198 |
+------------------+
1 row in set (0.01 sec)

mysql [information_schema]>select MEMORY_USAGE_BYTES / 1024/ 1024 as wg_mem_used_mb from workload_group_resource_usage where workload_group_id=11201;
+--------------------+
| wg_mem_used_mb     |
+--------------------+
| 499.96760272979736 |
+--------------------+
1 row in set (0.01 sec)
- Show memory by ps command, the max memory is 3.8G.
[ ~]$ ps -eo pid,comm,%mem,rss | grep 1407481
1407481 doris_be         1.0 4071364
[ ~]$ ps -eo pid,comm,%mem,rss | grep 1407481
1407481 doris_be         1.0 4059012
[ ~]$ ps -eo pid,comm,%mem,rss | grep 1407481
1407481 doris_be         1.0 4057068
- There are many query failed because of oom.
1724074250162,14126,1c_sql,HY000 1105,"java.sql.SQLException: errCode = 2, detailMessage = (127.0.0.1)[MEM_LIMIT_EXCEEDED]GC wg for hard limit, wg id:11201, name:g2, used:1.71 GB, limit:1.69 GB, backend:10.16.10.8. cancel top memory used tracker <Query#Id=4a0689936c444ac8-a0d01a50b944f6e7> consumption 1.71 GB. details:process memory used 3.01 GB exceed soft limit 304.41 GB or sys available memory 101.16 GB less than warning water mark 12.80 GB., Execute again after enough memory, details see be.INFO.",并发 1-3,text,false,,444,0,3,3,null,0,0,0
In this error message, you can see that the Workload Group used 1.7GB of memory, while the Workload Group's limit is 1.69GB. The calculation works as follows: 1.69GB = Physical machine memory (375GB) * mem_limit (value in be.conf, default is 0.9) * 0.5% (Workload Group's configuration). This means that the memory percentage configured in the Workload Group is calculated based on the available memory of the Doris process.
Suggestions
As demonstrated in the previous test, the hard limit can control the memory usage of a Workload Group, but it releases memory by killing queries, which can be a very unfriendly experience for users and may cause all queries to fail in extreme cases. Therefore, in a production environment, it is recommended to use memory hard limits in conjunction with query queuing. This approach can limit memory usage while ensuring the success rate of queries.
CPU hard limit Test
The workloads in Doris can generally be divided into three categories:
Core Report Queries: These are typically used by company executives to view reports. The load may not be very high, but the availability requirements are high. These queries can be grouped together and assigned a higher-priority soft limit, ensuring they receive more CPU resources when CPU availability is limited.
Ad-hoc Queries: These queries are usually exploratory, with random SQL and unpredictable resource usage. They typically have a lower priority, so they can be managed with a CPU hard limit set to a lower value, preventing them from consuming excessive CPU resources and reducing cluster availability.
ETL Queries: These queries have relatively fixed SQL and stable resource usage, though occasionally, a sudden increase in upstream data volume can cause a spike in resource usage. Therefore, they can be managed with a CPU hard limit configuration.
Different workloads consume CPU resources differently, and users have varying requirements for response latency. When the BE's CPU is heavily utilized, availability decreases and response latency increases. For example, an ad-hoc analytical query might fully utilize the cluster's CPU, causing increased latency for core reports and impacting the SLA. Therefore, a CPU isolation mechanism is needed to separate different types of workloads, ensuring cluster availability and meeting SLAs.
Workload Groups support both soft and hard CPU limits, with a current recommendation to configure Workload Groups with hard limits in production environments. This is because soft limits only come into effect when the CPU is fully utilized, but when the CPU is maxed out, internal components of Doris (e.g., RPC components) and available CPU resources for the operating system are reduced, leading to a significant decline in overall cluster availability. Therefore, in production environments, it's generally necessary to avoid situations where CPU resources are fully utilized, and the same applies to other resources such as memory.
Test env
1FE, 1BE(96 cores) Test data is clickbench,sql is q29.
Test
- Run query in 3 concurrent, using top command we can see it uses 76 cores.

- Alter workload group.
alter workload group g2 properties('cpu_hard_limit'='10%');
- Enable cpu hard limit,then all workload group could convert to hard limit.
ADMIN SET FRONTEND CONFIG ("enable_cpu_hard_limit" = "true");
- Test again, the BE using 9 ~ 10 cores, about 10%.

It should be noted that it's best to use query workloads for testing here, as they are more likely to reflect the intended effects. If you use high-throughput data import instead, it may trigger compaction, causing the observed values to be higher than the configured Workload Group limits. Currently, the compaction workload is not managed by the Workload Group.
- Use system table to show cpu usage, it's about 10%;
mysql [information_schema]>select CPU_USAGE_PERCENT from workload_group_resource_usage where WORKLOAD_GROUP_ID=11201;
+-------------------+
| CPU_USAGE_PERCENT |
+-------------------+
|              9.57 |
+-------------------+
1 row in set (0.02 sec)
NOTE
-
When configuring in practice, it's best not to have the total CPU allocation of all Groups add up to exactly 100%. This is primarily to ensure availability in low-latency scenarios, as some resources need to be reserved for other components. However, if the scenario is not sensitive to latency and the goal is maximum resource utilization, you can consider configuring the total CPU allocation of all Groups to equal 100%.
-
Currently, the time interval for the Frontend (FE) to synchronize Workload Group metadata to the Backend (BE) is 30 seconds, so it may take up to 30 seconds for changes to the Workload Group to take effect.
Test limit local IO
In OLAP systems, when performing ETL or large ad-hoc queries, a significant amount of data needs to be read. To speed up data analysis, Doris internally uses multithreading to scan multiple disk files in parallel, which generates a large amount of disk I/O and can negatively impact other queries, such as report analysis.
By using Workload Groups, you can group offline ETL data processing and online report queries separately and limit the I/O bandwidth for offline data processing, thereby reducing its impact on online report analysis.
Test
1FE,1BE(96 cores), test data is clickbench
Not limit IO
- Clear cache.
// clear OS cache.
sync; echo 3 > /proc/sys/vm/drop_caches

// disable BE's cache.
disable_storage_page_cache = true
- Run query one by one.
set dry_run_query = true;
select * from hits.hits;
- Show local IO by system table, is's 3G/s.
mysql [information_schema]>select LOCAL_SCAN_BYTES_PER_SECOND / 1024 / 1024 as mb_per_sec from workload_group_resource_usage where WORKLOAD_GROUP_ID=11201;
+--------------------+
| mb_per_sec         |
+--------------------+
| 1146.6208400726318 |
+--------------------+
1 row in set (0.03 sec)

mysql [information_schema]>select LOCAL_SCAN_BYTES_PER_SECOND / 1024 / 1024 as mb_per_sec from workload_group_resource_usage where WORKLOAD_GROUP_ID=11201;
+--------------------+
| mb_per_sec         |
+--------------------+
| 3496.2762966156006 |
+--------------------+
1 row in set (0.04 sec)

mysql [information_schema]>select LOCAL_SCAN_BYTES_PER_SECOND / 1024 / 1024 as mb_per_sec from workload_group_resource_usage where WORKLOAD_GROUP_ID=11201;
+--------------------+
| mb_per_sec         |
+--------------------+
| 2192.7690029144287 |
+--------------------+
1 row in set (0.02 sec)
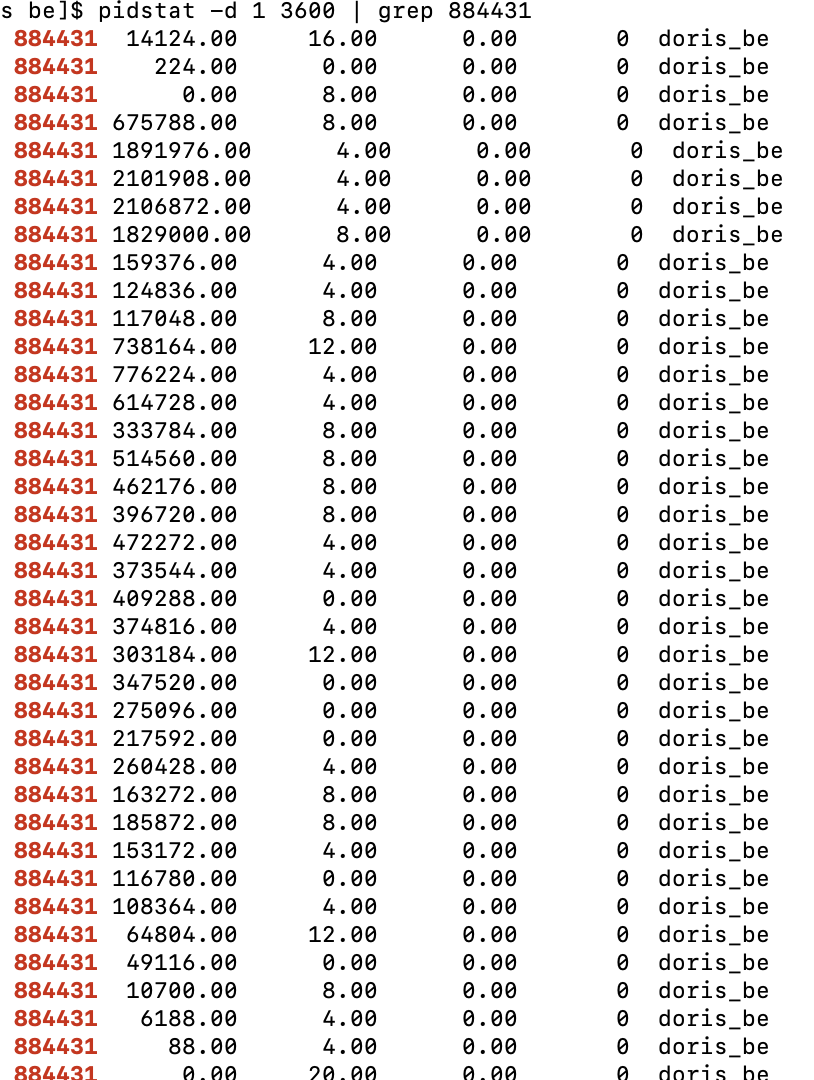
4.Show IO by pidstat, the first column in picture is process id, the second column is IO(kb/s), it's 2G/s.

Test IO limit.
- Clear cache.
// clear os cache
sync; echo 3 > /proc/sys/vm/drop_caches

// disable BE cache
disable_storage_page_cache = true
- Alter workload group.
alter workload group g2 properties('read_bytes_per_second'='104857600');
- Show IO by system table, it's about 98M/s.
mysql [information_schema]>select LOCAL_SCAN_BYTES_PER_SECOND / 1024 / 1024 as mb_per_sec from workload_group_resource_usage where WORKLOAD_GROUP_ID=11201;
+--------------------+
| mb_per_sec         |
+--------------------+
| 97.94296646118164  |
+--------------------+
1 row in set (0.03 sec)

mysql [information_schema]>select LOCAL_SCAN_BYTES_PER_SECOND / 1024 / 1024 as mb_per_sec from workload_group_resource_usage where WORKLOAD_GROUP_ID=11201;
+--------------------+
| mb_per_sec         |
+--------------------+
| 98.37584781646729  |
+--------------------+
1 row in set (0.04 sec)

mysql [information_schema]>select LOCAL_SCAN_BYTES_PER_SECOND / 1024 / 1024 as mb_per_sec from workload_group_resource_usage where WORKLOAD_GROUP_ID=11201;
+--------------------+
| mb_per_sec         |
+--------------------+
| 98.06641292572021  |
+--------------------+
1 row in set (0.02 sec)
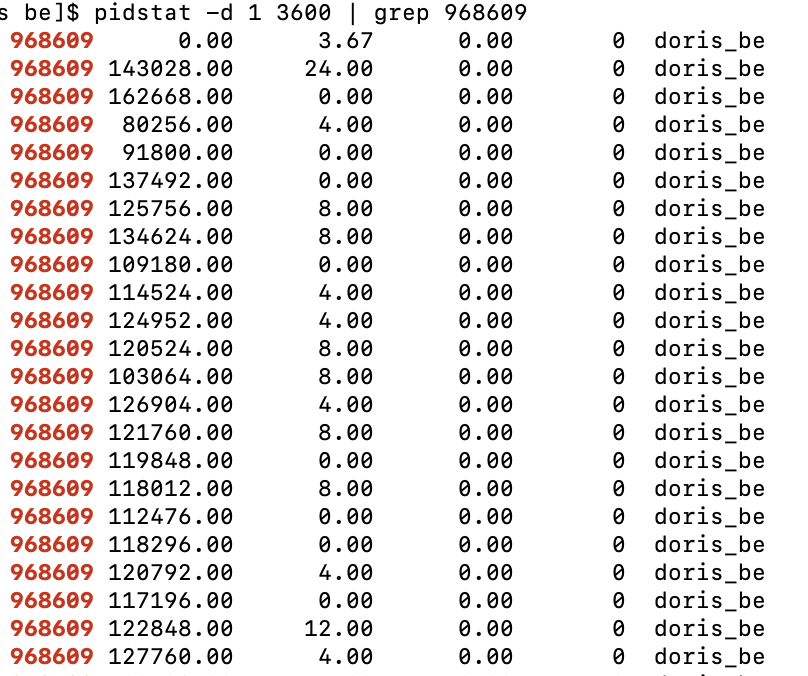
- Show IO by pidstat, the process IO is about 131M/s。

NOTE
- The LOCAL_SCAN_BYTES_PER_SECOND field in the system table represents the aggregated statistics at the process level for the current Workload Group. For example, if 12 file paths are configured, LOCAL_SCAN_BYTES_PER_SECOND represents the maximum I/O value across these 12 file paths. If you want to see the I/O throughput for each file path individually, you can view detailed values in Grafana or through the BE's bvar monitoring.
- Due to the presence of the operating system's and Doris's Page Cache, the I/O values observed using Linux's I/O monitoring scripts are usually smaller than those seen in the system table.
BrokerLoad and S3Load are commonly used methods for importing large volumes of data. Users can first upload data to HDFS or S3 and then use BrokerLoad and S3Load for parallel data imports. To speed up the import process, Doris uses multithreading to pull data from HDFS/S3 in parallel. This can put significant pressure on HDFS/S3, potentially causing instability for other jobs running on HDFS/S3.
You can use the remote I/O limitation feature of Workload Groups to limit the bandwidth used during the import process, thereby reducing the impact on other operations.
Test limit remote IO
Test env
1FE,1BE(16 cores, 64G), test data is clickbench,Before testing, the dataset needs to be uploaded to S3. To save time, we will upload only 10 million rows of data, and then use the TVF (Table-Valued Function) feature to query the data from S3.
Show schema info after upload.
DESC FUNCTION s3 (
    "URI" = "https://bucketname/1kw.tsv",
    "s3.access_key"= "ak",
    "s3.secret_key" = "sk",
    "format" = "csv",
    "use_path_style"="true"
);
Test not limit remote IO
- Run query one by one.
// just scan, not return value.
set dry_run_query = true;

SELECT * FROM s3(
    "URI" = "https://bucketname/1kw.tsv",
    "s3.access_key"= "ak",
    "s3.secret_key" = "sk",
    "format" = "csv",
    "use_path_style"="true"
);
- Show remote IO by system table,it's about 837M/s, It should be noted that the actual I/O throughput here is significantly affected by the environment. If the machine hosting the BE has a low bandwidth connection to external storage, the actual throughput may be lower.
MySQL [(none)]> select cast(REMOTE_SCAN_BYTES_PER_SECOND/1024/1024 as int) as read_mb from information_schema.workload_group_resource_usage;
+---------+
| read_mb |
+---------+
|     837 |
+---------+
1 row in set (0.104 sec)

MySQL [(none)]> select cast(REMOTE_SCAN_BYTES_PER_SECOND/1024/1024 as int) as read_mb from information_schema.workload_group_resource_usage;
+---------+
| read_mb |
+---------+
|     867 |
+---------+
1 row in set (0.070 sec)

MySQL [(none)]> select cast(REMOTE_SCAN_BYTES_PER_SECOND/1024/1024 as int) as read_mb from information_schema.workload_group_resource_usage;
+---------+
| read_mb |
+---------+
|     867 |
+---------+
1 row in set (0.186 sec)
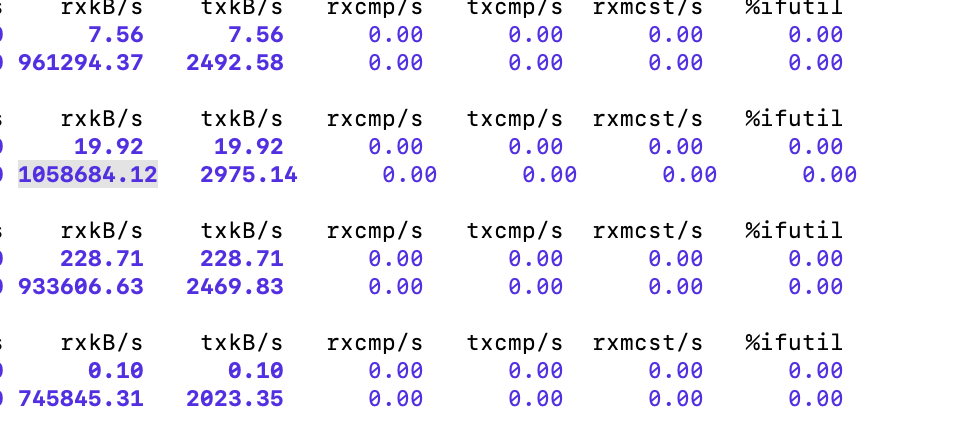
- Using sar(sar -n DEV 1 3600) to show network bandwidth of the machine, the max value is about 1033M/s.The first column of the output is the number of bytes received per second by a certain network card of the current machine, in KB per second.

Test limit remote IO
- Alter workload group.
alter workload group normal properties('remote_read_bytes_per_second'='104857600');
- Run query one by one.
// just scan not return.
set dry_run_query = true;


SELECT * FROM s3(
    "URI" = "https://bucketname/1kw.tsv",
    "s3.access_key"= "ak",
    "s3.secret_key" = "sk",
    "format" = "csv",
    "use_path_style"="true"
);
- Use the system table to check the current remote read I/O throughput. At this moment, the I/O throughput is around 100M, with some fluctuation. This fluctuation is influenced by the current algorithm design and typically includes a peak, but it does not last long and is considered normal.
MySQL [(none)]> select cast(REMOTE_SCAN_BYTES_PER_SECOND/1024/1024 as int) as read_mb from information_schema.workload_group_resource_usage;
+---------+
| read_mb |
+---------+
|      56 |
+---------+
1 row in set (0.010 sec)

MySQL [(none)]> select cast(REMOTE_SCAN_BYTES_PER_SECOND/1024/1024 as int) as read_mb from information_schema.workload_group_resource_usage;
+---------+
| read_mb |
+---------+
|     131 |
+---------+
1 row in set (0.009 sec)

MySQL [(none)]> select cast(REMOTE_SCAN_BYTES_PER_SECOND/1024/1024 as int) as read_mb from information_schema.workload_group_resource_usage;
+---------+
| read_mb |
+---------+
|     111 |
+---------+
1 row in set (0.009 sec)
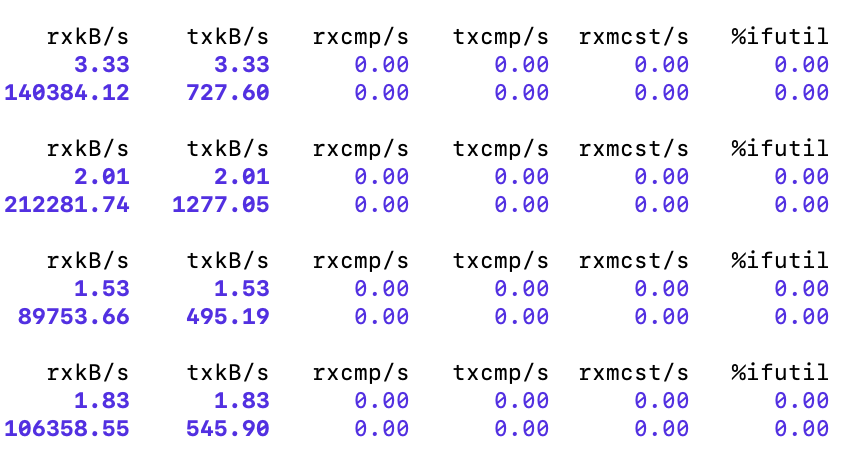
- Using sar(sar -n DEV 1 3600) to show network bandwidth, the max IO is about 207M, This indicates that remote limit IO works. However, since the sar command shows machine-level traffic, the values may be higher than those reported by Doris.


