Use Workload Group limit CPU
The workloads in Doris can generally be divided into three categories:
Core Report Queries: These are typically used by company executives to view reports. The load may not be very high, but the availability requirements are high. These queries can be grouped together and assigned a higher-priority soft limit, ensuring they receive more CPU resources when CPU availability is limited.
Ad-hoc Queries: These queries are usually exploratory, with random SQL and unpredictable resource usage. They typically have a lower priority, so they can be managed with a CPU hard limit set to a lower value, preventing them from consuming excessive CPU resources and reducing cluster availability.
ETL Queries: These queries have relatively fixed SQL and stable resource usage, though occasionally, a sudden increase in upstream data volume can cause a spike in resource usage. Therefore, they can be managed with a CPU hard limit configuration.
Different workloads consume CPU resources differently, and users have varying requirements for response latency. When the BE's CPU is heavily utilized, availability decreases and response latency increases. For example, an ad-hoc analytical query might fully utilize the cluster's CPU, causing increased latency for core reports and impacting the SLA. Therefore, a CPU isolation mechanism is needed to separate different types of workloads, ensuring cluster availability and meeting SLAs.
Workload Groups support both soft and hard CPU limits, with a current recommendation to configure Workload Groups with hard limits in production environments. This is because soft limits only come into effect when the CPU is fully utilized, but when the CPU is maxed out, internal components of Doris (e.g., RPC components) and available CPU resources for the operating system are reduced, leading to a significant decline in overall cluster availability. Therefore, in production environments, it's generally necessary to avoid situations where CPU resources are fully utilized, and the same applies to other resources such as memory.
CPU hard limit Test
Test env
1FE, 1BE(96 cores) Test data is clickbench,sql is q29.
Test
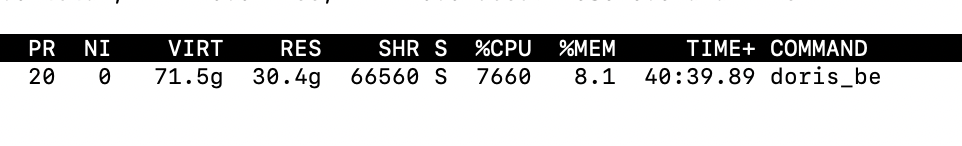
- Run query in 3 concurrent, using top command we can see it uses 76 cores.
- Alter workload group.
alter workload group g2 properties('cpu_hard_limit'='10%');
- Enable cpu hard limit,then all workload group could convert to hard limit.
ADMIN SET FRONTEND CONFIG ("enable_cpu_hard_limit" = "true");
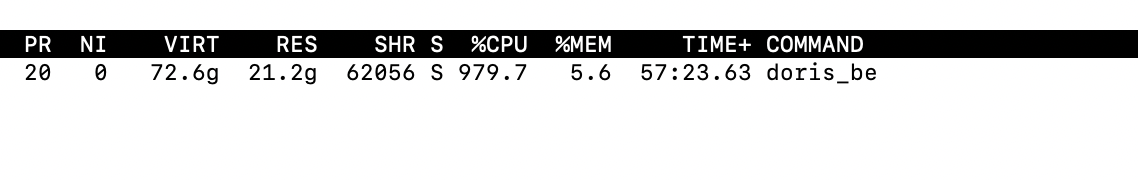
- Test again, the BE using 9 ~ 10 cores, about 10%.
It should be noted that it's best to use query workloads for testing here, as they are more likely to reflect the intended effects. If you use high-throughput data import instead, it may trigger compaction, causing the observed values to be higher than the configured Workload Group limits. Currently, the compaction workload is not managed by the Workload Group.
- Use system table to show cpu usage, it's about 10%;
mysql [information_schema]>select CPU_USAGE_PERCENT from workload_group_resource_usage where WORKLOAD_GROUP_ID=11201;
+-------------------+
| CPU_USAGE_PERCENT |
+-------------------+
|              9.57 |
+-------------------+
1 row in set (0.02 sec)
NOTE
-
When configuring in practice, it's best not to have the total CPU allocation of all Groups add up to exactly 100%. This is primarily to ensure availability in low-latency scenarios, as some resources need to be reserved for other components. However, if the scenario is not sensitive to latency and the goal is maximum resource utilization, you can consider configuring the total CPU allocation of all Groups to equal 100%.
-
Currently, the time interval for the Frontend (FE) to synchronize Workload Group metadata to the Backend (BE) is 30 seconds, so it may take up to 30 seconds for changes to the Workload Group to take effect.
