Use Workload Group limit local IO
In OLAP systems, when performing ETL or large ad-hoc queries, a significant amount of data needs to be read. To speed up data analysis, Doris internally uses multithreading to scan multiple disk files in parallel, which generates a large amount of disk I/O and can negatively impact other queries, such as report analysis.
By using Workload Groups, you can group offline ETL data processing and online report queries separately and limit the I/O bandwidth for offline data processing, thereby reducing its impact on online report analysis.
Test limit local IO
Test
1FE,1BE(96 cores), test data is clickbench
Not limit IO
- Clear cache.
// clear OS cache.
sync; echo 3 > /proc/sys/vm/drop_caches

// disable BE's cache.
disable_storage_page_cache = true
- Run query one by one.
set dry_run_query = true;
select * from hits.hits;
- Show local IO by system table, is's 3G/s.
mysql [information_schema]>select LOCAL_SCAN_BYTES_PER_SECOND / 1024 / 1024 as mb_per_sec from workload_group_resource_usage where WORKLOAD_GROUP_ID=11201;
+--------------------+
| mb_per_sec         |
+--------------------+
| 1146.6208400726318 |
+--------------------+
1 row in set (0.03 sec)

mysql [information_schema]>select LOCAL_SCAN_BYTES_PER_SECOND / 1024 / 1024 as mb_per_sec from workload_group_resource_usage where WORKLOAD_GROUP_ID=11201;
+--------------------+
| mb_per_sec         |
+--------------------+
| 3496.2762966156006 |
+--------------------+
1 row in set (0.04 sec)

mysql [information_schema]>select LOCAL_SCAN_BYTES_PER_SECOND / 1024 / 1024 as mb_per_sec from workload_group_resource_usage where WORKLOAD_GROUP_ID=11201;
+--------------------+
| mb_per_sec         |
+--------------------+
| 2192.7690029144287 |
+--------------------+
1 row in set (0.02 sec)
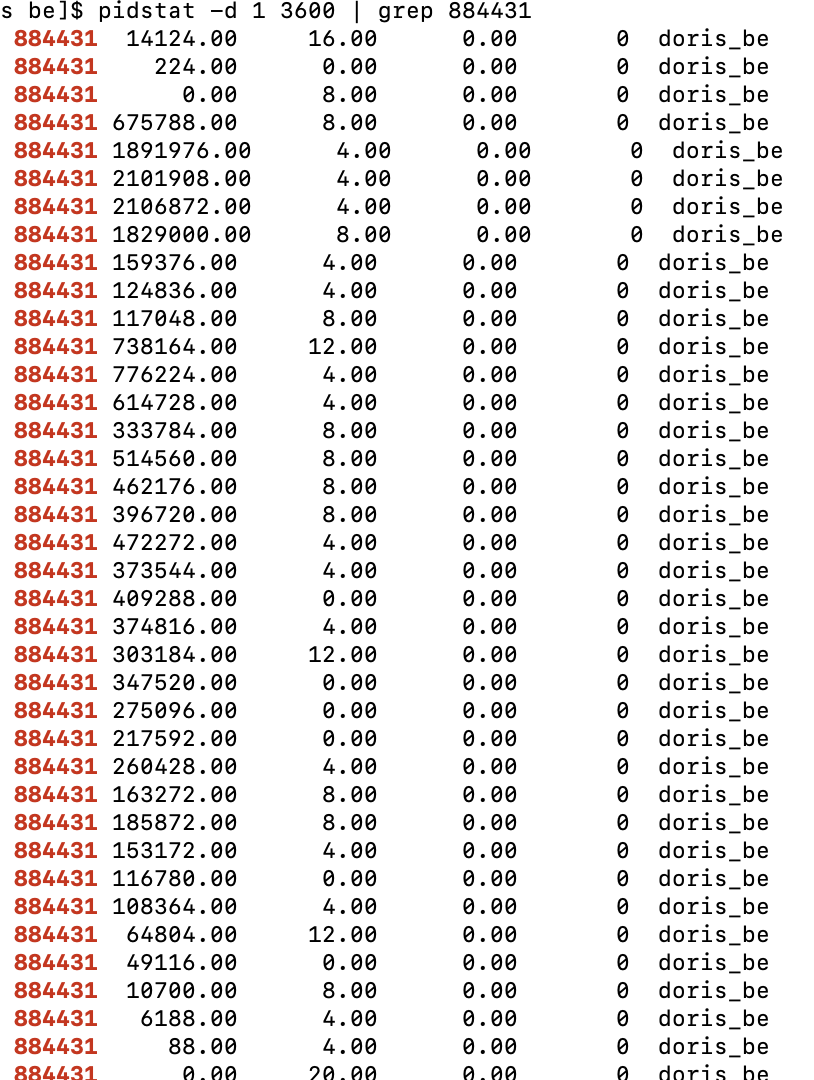
4.Show IO by pidstat, the first column in picture is process id, the second column is IO(kb/s), it's 2G/s.
Test IO limit.
- Clear cache.
// clear os cache
sync; echo 3 > /proc/sys/vm/drop_caches

// disable BE cache
disable_storage_page_cache = true
- Alter workload group.
alter workload group g2 properties('read_bytes_per_second'='104857600');
- Show IO by system table, it's about 98M/s.
mysql [information_schema]>select LOCAL_SCAN_BYTES_PER_SECOND / 1024 / 1024 as mb_per_sec from workload_group_resource_usage where WORKLOAD_GROUP_ID=11201;
+--------------------+
| mb_per_sec         |
+--------------------+
| 97.94296646118164  |
+--------------------+
1 row in set (0.03 sec)

mysql [information_schema]>select LOCAL_SCAN_BYTES_PER_SECOND / 1024 / 1024 as mb_per_sec from workload_group_resource_usage where WORKLOAD_GROUP_ID=11201;
+--------------------+
| mb_per_sec         |
+--------------------+
| 98.37584781646729  |
+--------------------+
1 row in set (0.04 sec)

mysql [information_schema]>select LOCAL_SCAN_BYTES_PER_SECOND / 1024 / 1024 as mb_per_sec from workload_group_resource_usage where WORKLOAD_GROUP_ID=11201;
+--------------------+
| mb_per_sec         |
+--------------------+
| 98.06641292572021  |
+--------------------+
1 row in set (0.02 sec)
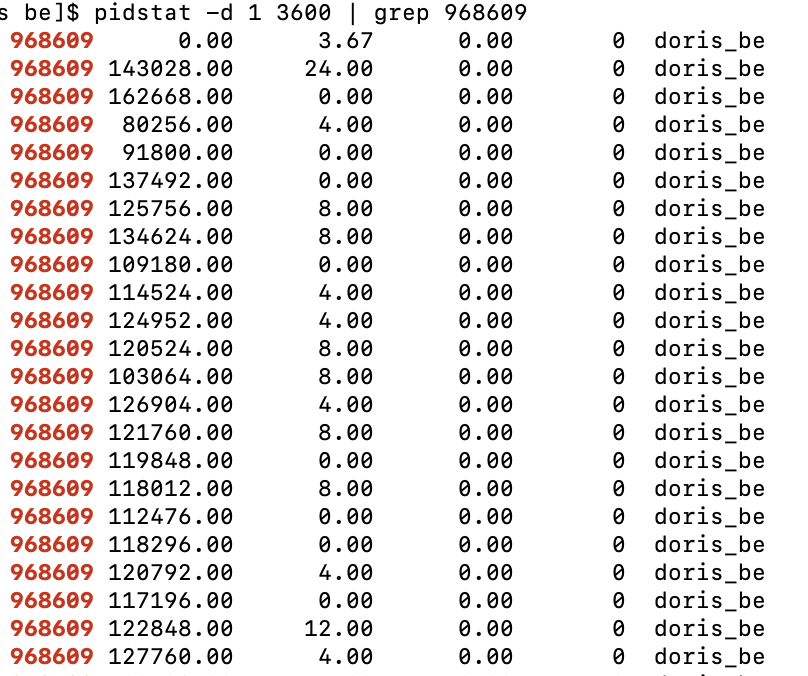
- Show IO by pidstat, the process IO is about 131M/s。
NOTE
- The LOCAL_SCAN_BYTES_PER_SECOND field in the system table represents the aggregated statistics at the process level for the current Workload Group. For example, if 12 file paths are configured, LOCAL_SCAN_BYTES_PER_SECOND represents the maximum I/O value across these 12 file paths. If you want to see the I/O throughput for each file path individually, you can view detailed values in Grafana or through the BE's bvar monitoring.
- Due to the presence of the operating system's and Doris's Page Cache, the I/O values observed using Linux's I/O monitoring scripts are usually smaller than those seen in the system table.
