Overview
Query performance tuning is systematic engineering that requires optimization of the database system from multiple levels and dimensions. Below is an overview of the tuning process and methodology:
-
Firstly, business personnel and database administrators (DBAs) need to have a comprehensive understanding of the system in use. This includes the hardware utilized by the business system, the size of the cluster, the version of the database software being used, and the specific features offered by that software version.
-
Secondly, having an efficient and user-friendly performance diagnostic tool is essential for identifying performance issues. Only by quickly and effectively pinpointing slow SQL queries can subsequent SQL performance tuning be carried out.
-
Once entering the performance tuning phase, common tuning tools become indispensable. These tools should provide detailed information about the specific execution of SQL queries to help locate corresponding performance bottlenecks.
In summary, performance tuning requires a holistic view to observe and assess the current system's performance status. It involves identifying specific business SQL queries with performance issues, using tuning tools to discover the specific performance bottlenecks, and then proceeding with targeted tuning efforts.
Based on the aforementioned tuning process and methodology, Apache Doris provides corresponding tools at each level. The following sections will introduce three aspects: performance diagnostic tools, tuning tools, and tuning processes.
Performance Diagnostic Tools
Efficient and user-friendly performance diagnostic tools are crucial for tuning database systems as they directly impact the ability to quickly identify slow business SQL queries with performance issues, subsequently enabling rapid resolution of specific performance bottlenecks and ensuring service level agreements (SLAs) for database system services.
Currently, Doris identifies SQL queries with an execution time exceeding 5 seconds as slow SQL (this threshold can be configured via config.qe_slow_log_ms). Doris offers two diagnostic channels to quickly locate slow SQL queries with performance issues:
Doris Manager Monitoring and Logs
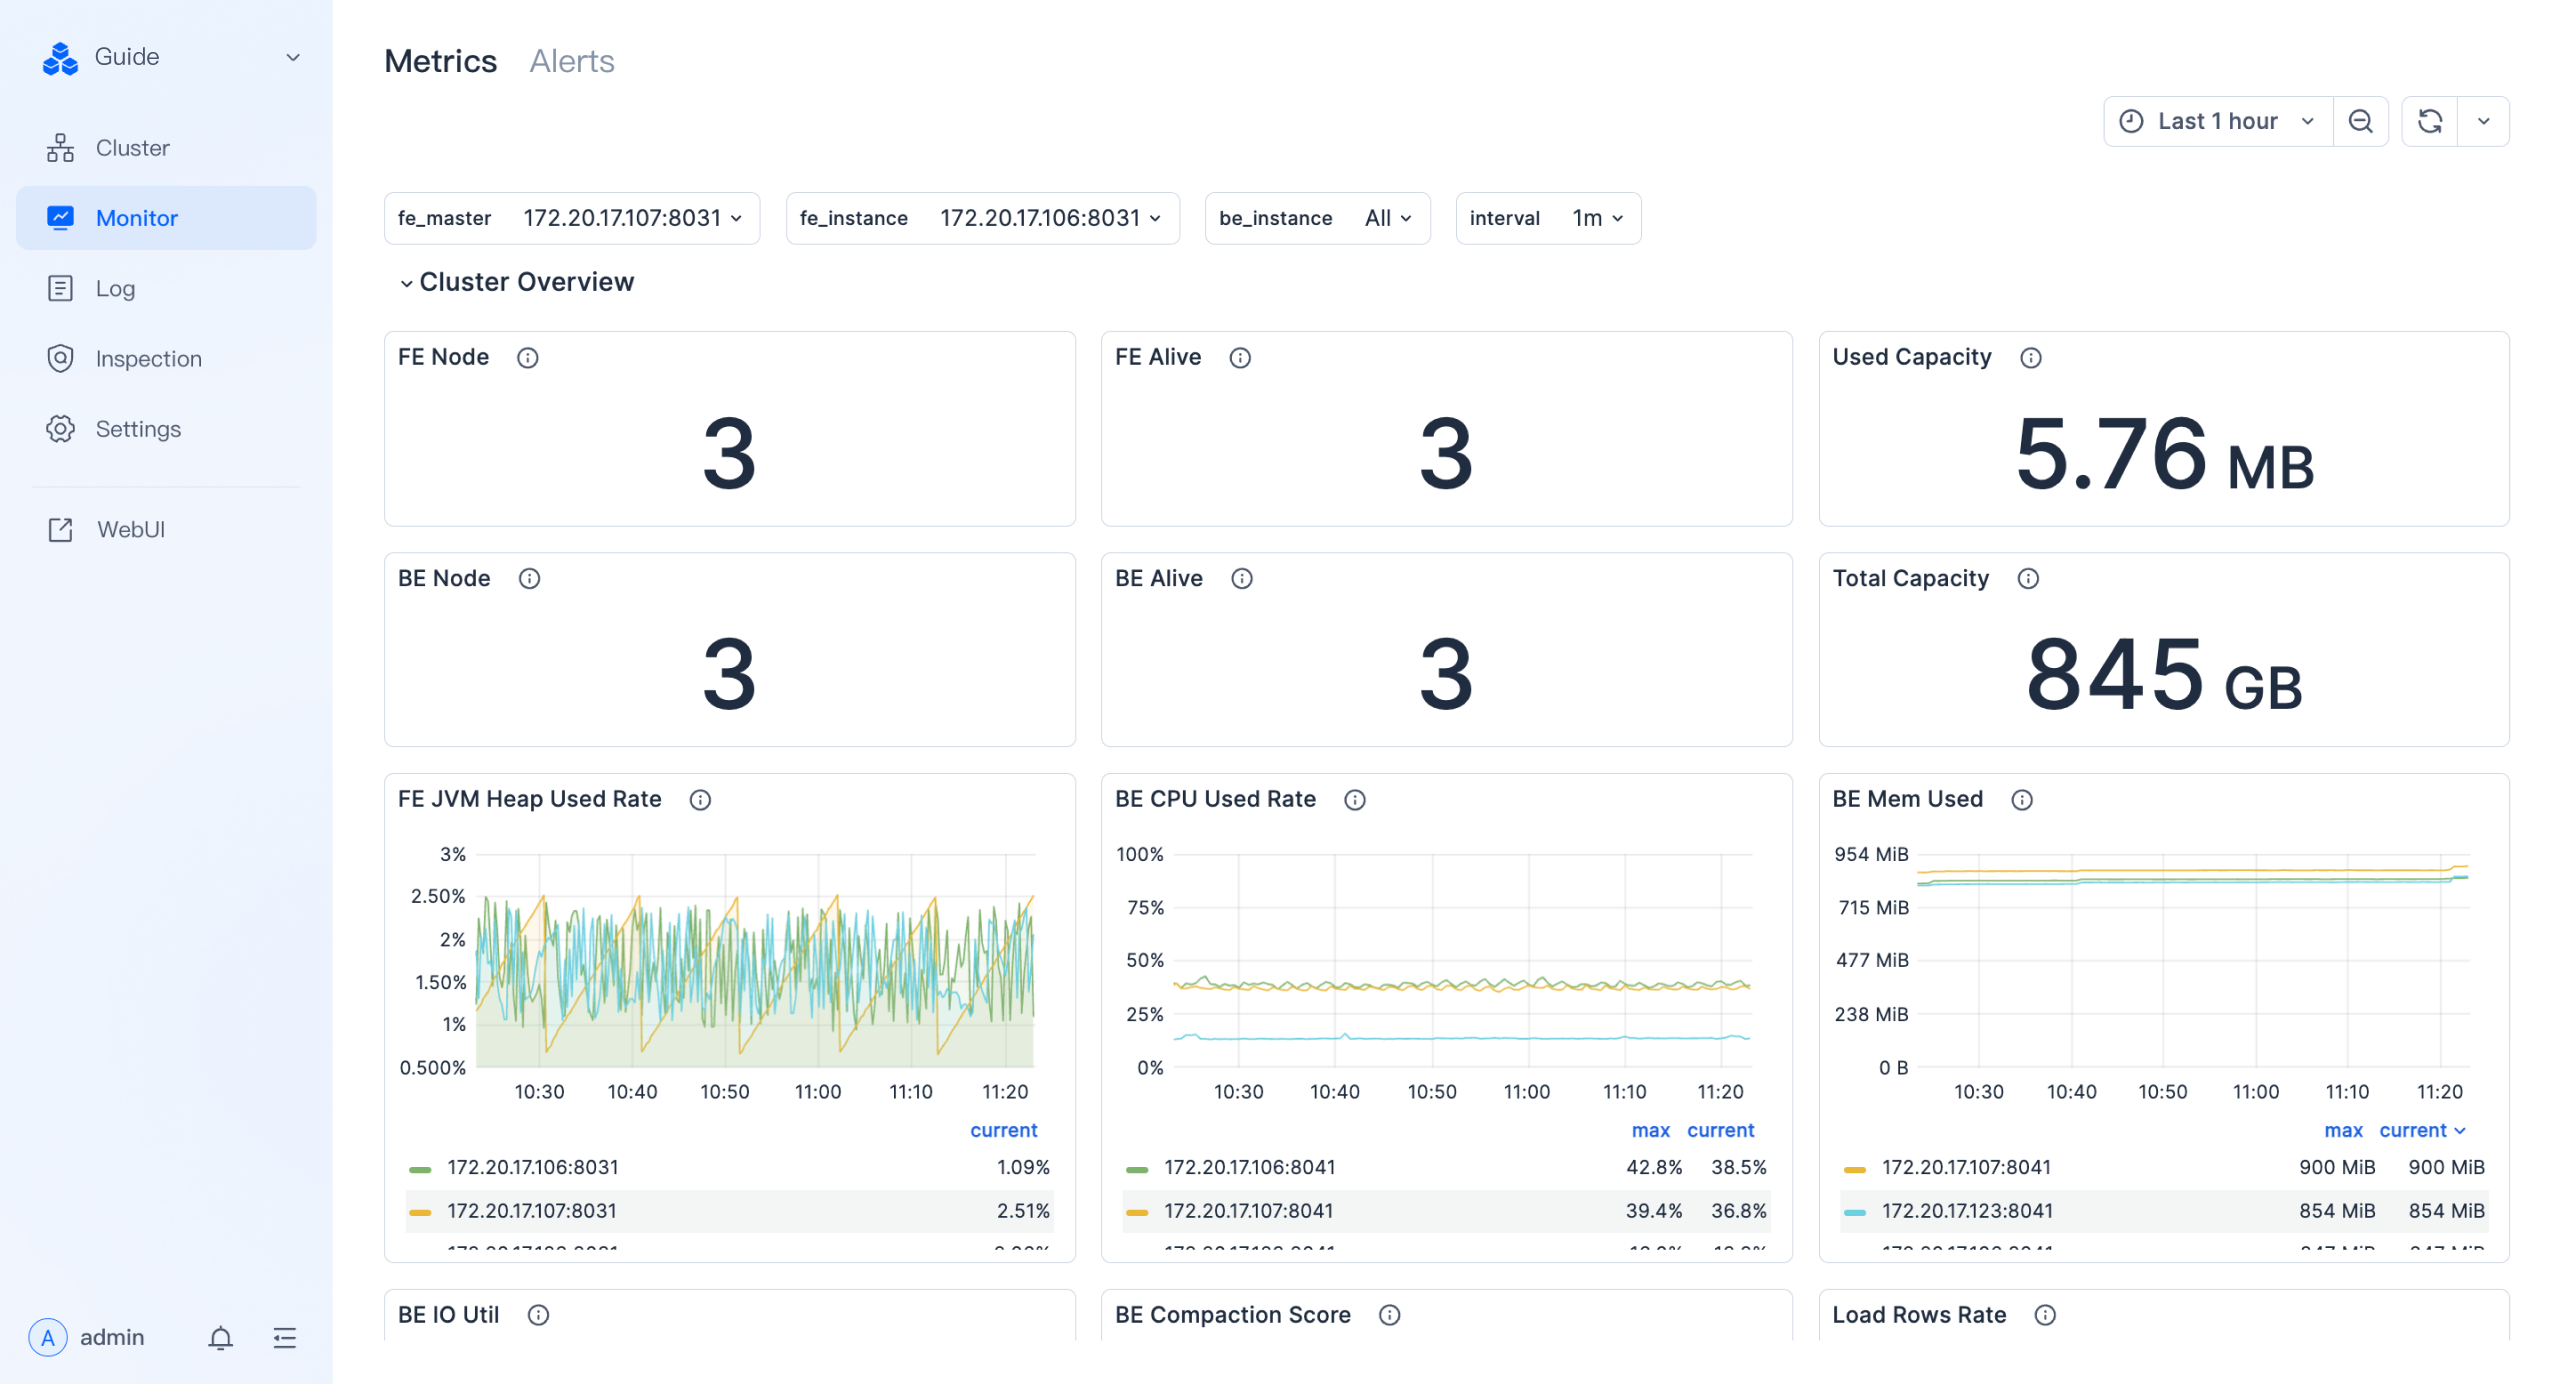
Doris Manager monitoring provides a rich functional interface, allowing users to easily access basic information such as cluster details, hardware information, Doris version information, as well as real-time monitoring data for FE/BE nodes across CPU, MEM, IO, and NETWORK dimensions. As shown in the following image:
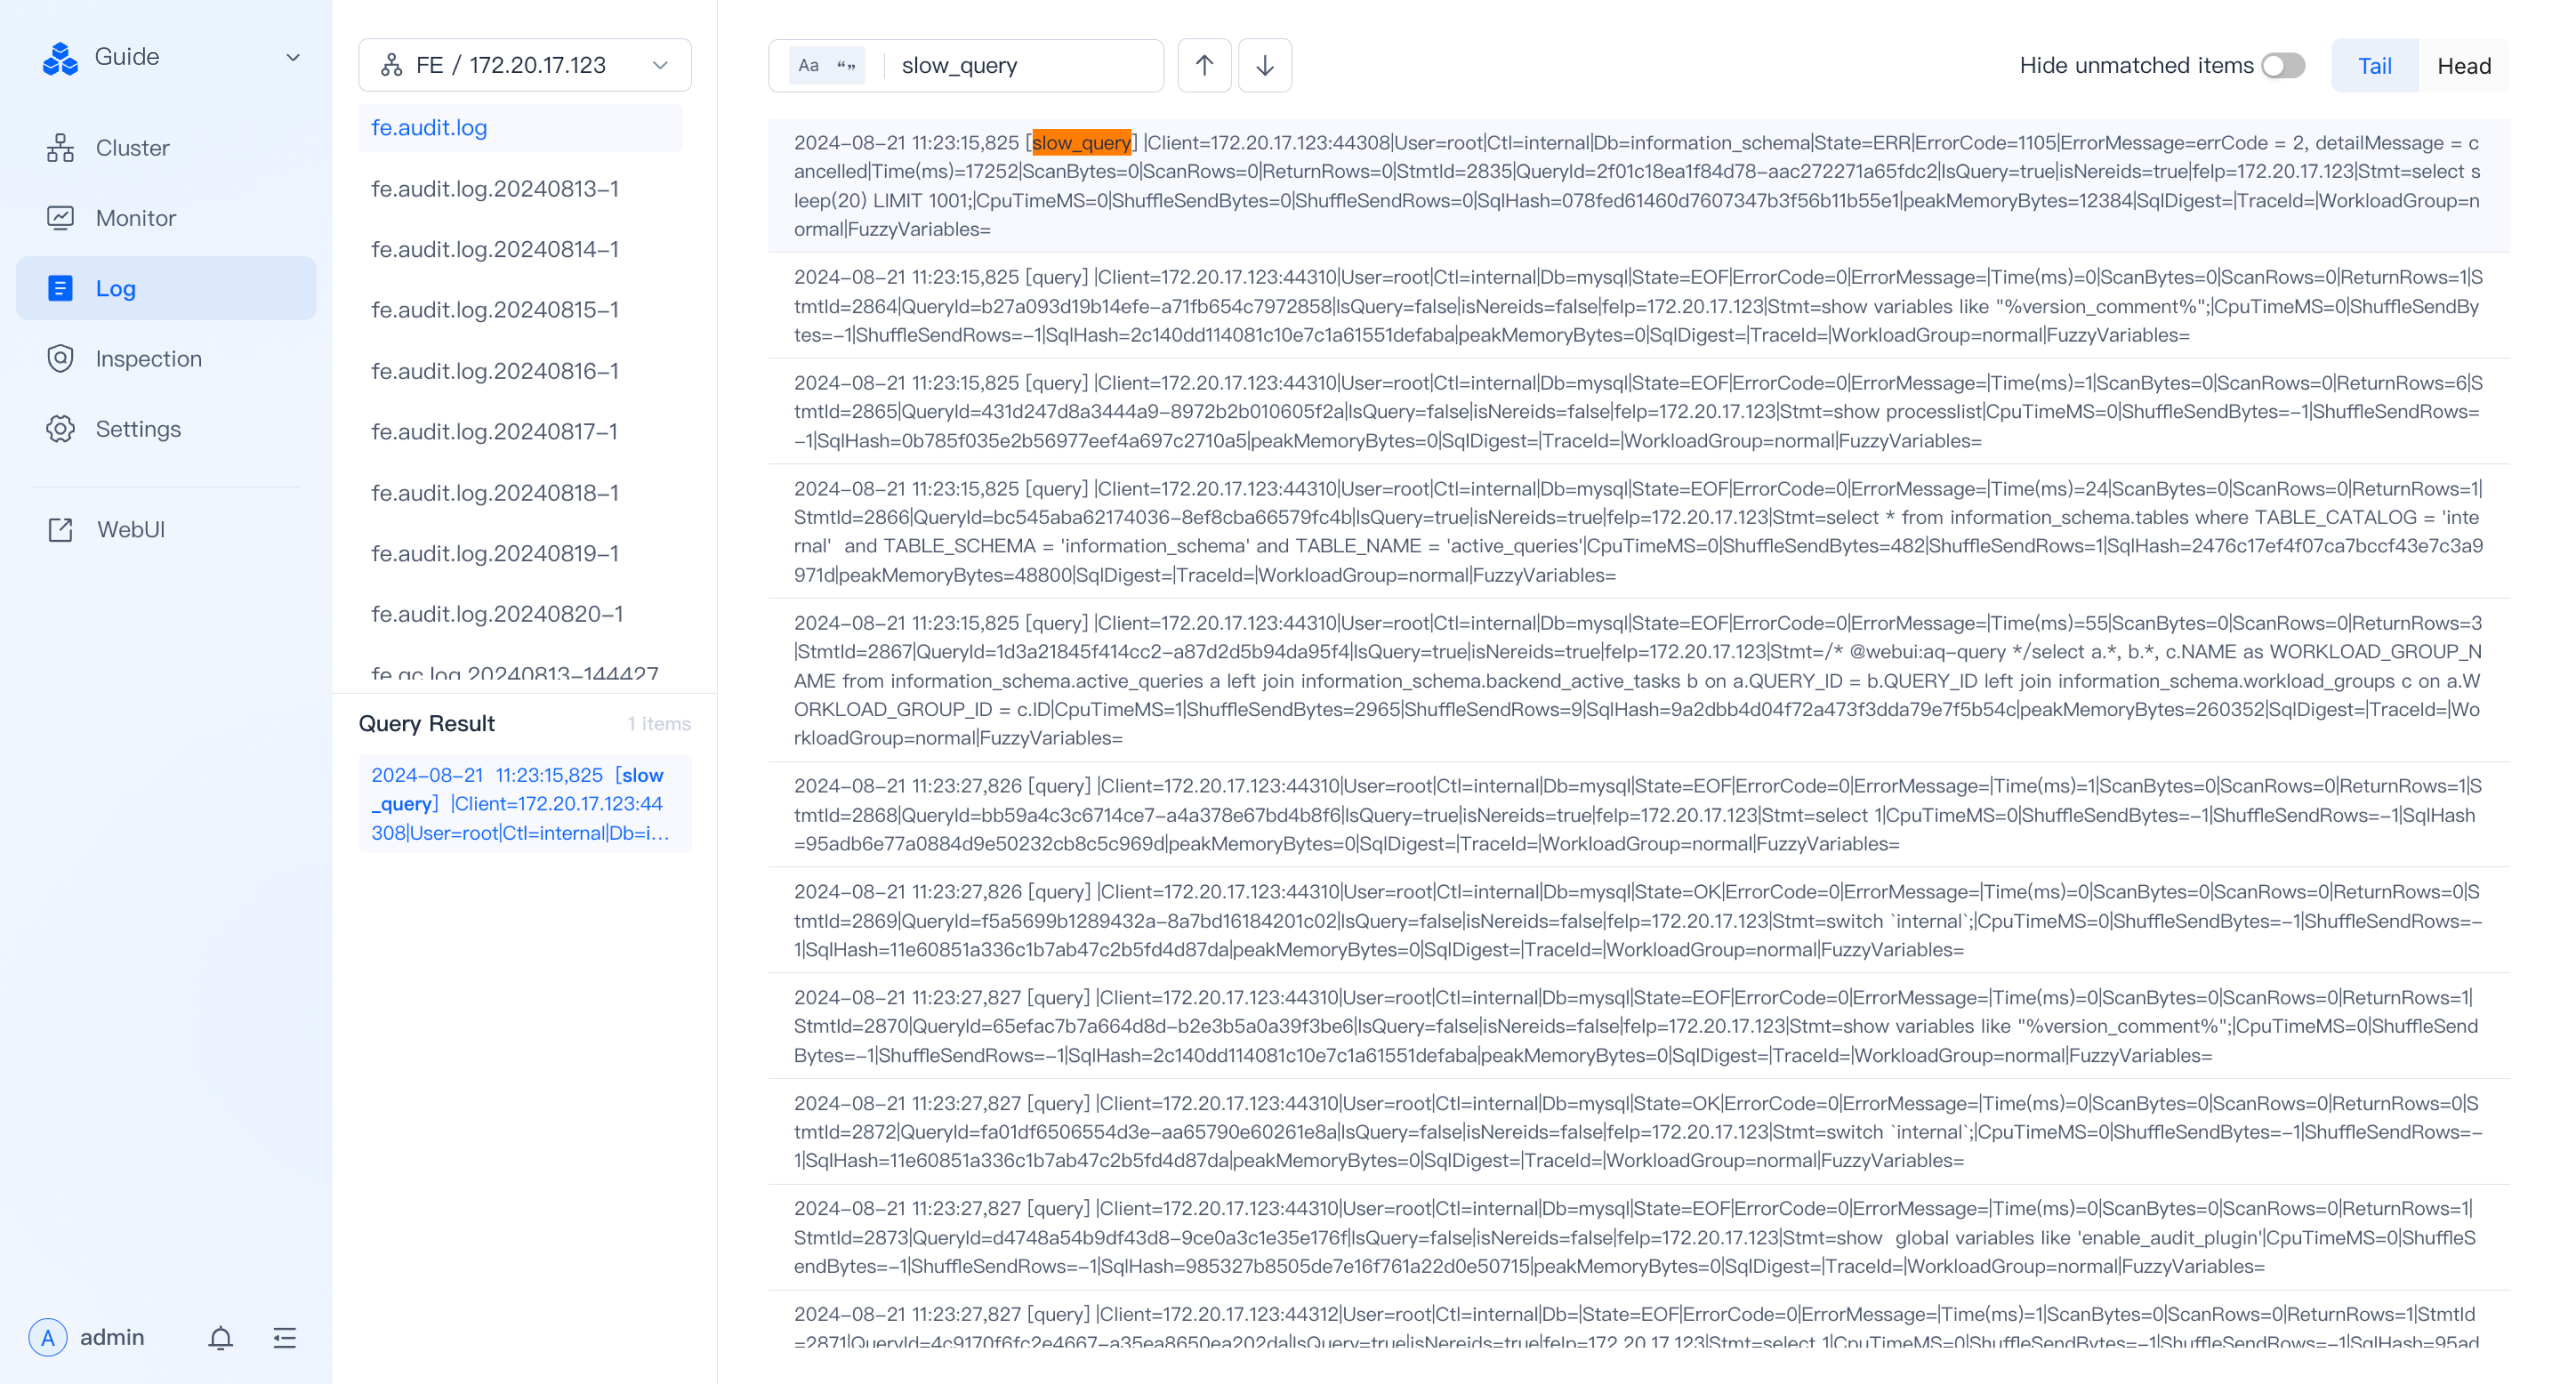
In terms of performance monitoring, Manager currently provides a log-based approach to locate slow SQL queries. Users can view slow SQL by selecting the fe.audit.log on a specific FE node. Simply entering "slow_query" in the search box will display the system's historical slow SQL information on the page, as shown below:
Direct Access to fe.audit.log
Doris FE currently offers four types of Audit Logs: slow_query, query, load, and stream_load. In addition to accessing these logs through the log page on clusters where the Manager service is installed, users can also directly access the fe/log/fe.audit.log file on the FE node.
By directly examining the slow_query tags in fe.audit.log, users can quickly filter out slow SQL queries, as shown below:
2024-07-18 11:23:13,042 [slow_query] |Client=127.0.0.1:63510|User=root|Ctl=internal|Db=tpch_sf1000|State=EOF|ErrorCode=0|ErrorMessage=|Time(ms)=11603|ScanBytes=236667379712|ScanRows=13649979418|ReturnRows=100|StmtId=1689|QueryId=91ff336304f14182-9ca537eee75b3856|IsQuery=true|isNereids=true|feIp=172.21.0.10|Stmt=select     c_name,     c_custkey,     o_orderkey,     o_orderdate,     o_totalprice,     sum(l_quantity) from     customer,     orders,     lineitem where     o_orderkey  in  (         select             l_orderkey         from             lineitem         group  by             l_orderkey  having                 sum(l_quantity)  >  300     )     and  c_custkey  =  o_custkey     and  o_orderkey  =  l_orderkey group  by     c_name,     c_custkey,     o_orderkey,     o_orderdate,     o_totalprice order  by     o_totalprice  desc,     o_orderdate limit  100|CpuTimeMS=918556|ShuffleSendBytes=3267419|ShuffleSendRows=89668|SqlHash=b4e1de9f251214a30188180f37907f7d|peakMemoryBytes=38720935552|SqlDigest=d41d8cd98f00b204e9800998ecf8427e|cloudClusterName=UNKNOWN|TraceId=|WorkloadGroup=normal|FuzzyVariables=|scanBytesFromLocalStorage=0|scanBytesFromRemoteStorage=0
2024-07-18 11:23:33,043 [slow_query] |Client=127.0.0.1:26672|User=root|Ctl=internal|Db=tpch_sf1000|State=EOF|ErrorCode=0|ErrorMessage=|Time(ms)=8978|ScanBytes=334985555968|ScanRows=10717654374|ReturnRows=100|StmtId=1815|QueryId=6e1fae453cb04d9a-b1e5f94d9cea1885|IsQuery=true|isNereids=true|feIp=172.21.0.10|Stmt=select     s_name,     count(*) as numwait from     supplier,     lineitem l1,     orders,     nation where     s_suppkey = l1.l_suppkey     and o_orderkey = l1.l_orderkey     and o_orderstatus = 'F'     and l1.l_receiptdate > l1.l_commitdate     and exists (         select             *         from             lineitem l2         where                 l2.l_orderkey = l1.l_orderkey           and l2.l_suppkey <> l1.l_suppkey     )     and not exists (         select             *         from             lineitem l3         where                 l3.l_orderkey = l1.l_orderkey           and l3.l_suppkey <> l1.l_suppkey           and l3.l_receiptdate > l3.l_commitdate     )     and s_nationkey = n_nationkey     and n_name = 'SAUDI ARABIA' group by     s_name order by     numwait desc,     s_name limit 100|CpuTimeMS=990127|ShuffleSendBytes=59208164|ShuffleSendRows=3651504|SqlHash=f8a30e4182d72cce3eff6cb385005b1f|peakMemoryBytes=10495660672|SqlDigest=d41d8cd98f00b204e9800998ecf8427e|cloudClusterName=UNKNOWN|TraceId=|WorkloadGroup=normal|FuzzyVariables=|scanBytesFromLocalStorage=0|scanBytesFromRemoteStorage=0
2024-07-18 11:23:41,044 [slow_query] |Client=127.0.0.1:26684|User=root|Ctl=internal|Db=tpch_sf1000|State=EOF|ErrorCode=0|ErrorMessage=|Time(ms)=8514|ScanBytes=334986551296|ScanRows=10717654374|ReturnRows=100|StmtId=1833|QueryId=4f91483464ce4aa8-beeed7dcb8675bc8|IsQuery=true|isNereids=true|feIp=172.21.0.10|Stmt=select     s_name,     count(*) as numwait from     supplier,     lineitem l1,     orders,     nation where     s_suppkey = l1.l_suppkey     and o_orderkey = l1.l_orderkey     and o_orderstatus = 'F'     and l1.l_receiptdate > l1.l_commitdate     and exists (         select             *         from             lineitem l2         where                 l2.l_orderkey = l1.l_orderkey           and l2.l_suppkey <> l1.l_suppkey     )     and not exists (         select             *         from             lineitem l3         where                 l3.l_orderkey = l1.l_orderkey           and l3.l_suppkey <> l1.l_suppkey           and l3.l_receiptdate > l3.l_commitdate     )     and s_nationkey = n_nationkey     and n_name = 'SAUDI ARABIA' group by     s_name order by     numwait desc,     s_name limit 100|CpuTimeMS=925841|ShuffleSendBytes=59223190|ShuffleSendRows=3651602|SqlHash=f8a30e4182d72cce3eff6cb385005b1f|peakMemoryBytes=10505123104|SqlDigest=d41d8cd98f00b204e9800998ecf8427e|cloudClusterName=UNKNOWN|TraceId=|WorkloadGroup=normal|FuzzyVariables=|scanBytesFromLocalStorage=0|scanBytesFromRemoteStorage=0
2024-07-18 11:23:49,044 [slow_query] |Client=127.0.0.1:10748|User=root|Ctl=internal|Db=tpch_sf1000|State=EOF|ErrorCode=0|ErrorMessage=|Time(ms)=8660|ScanBytes=334987673600|ScanRows=10717654374|ReturnRows=100|StmtId=1851|QueryId=4599cb1bab204f80-ac430dd78b45e3da|IsQuery=true|isNereids=true|feIp=172.21.0.10|Stmt=select     s_name,     count(*) as numwait from     supplier,     lineitem l1,     orders,     nation where     s_suppkey = l1.l_suppkey     and o_orderkey = l1.l_orderkey     and o_orderstatus = 'F'     and l1.l_receiptdate > l1.l_commitdate     and exists (         select             *         from             lineitem l2         where                 l2.l_orderkey = l1.l_orderkey           and l2.l_suppkey <> l1.l_suppkey     )     and not exists (         select             *         from             lineitem l3         where                 l3.l_orderkey = l1.l_orderkey           and l3.l_suppkey <> l1.l_suppkey           and l3.l_receiptdate > l3.l_commitdate     )     and s_nationkey = n_nationkey     and n_name = 'SAUDI ARABIA' group by     s_name order by     numwait desc,     s_name limit 100|CpuTimeMS=932664|ShuffleSendBytes=59223178|ShuffleSendRows=3651991|SqlHash=f8a30e4182d72cce3eff6cb385005b1f|peakMemoryBytes=10532849344|SqlDigest=d41d8cd98f00b204e9800998ecf8427e|cloudClusterName=UNKNOWN|TraceId=|WorkloadGroup=normal|FuzzyVariables=|scanBytesFromLocalStorage=0|scanBytesFromRemoteStorage=0
The slow SQL obtained from fe.audit.log provides detailed information such as execution time, scanned rows, returned rows, and the SQL statement itself, laying a foundation for further reproducing and locating performance issues.
Performance Tuning Tools
The diagnostic tools mentioned above have already assisted users and operators in identifying specific slow SQL queries. Next, we will proceed to analyze and optimize these slow SQL queries.
For a specific slow SQL query, the first step is to conduct a performance bottleneck analysis to determine the exact source of the slowdown.
The execution process of an SQL query can broadly be divided into two stages: plan generation and plan execution. Issues in either of these parts can lead to performance bottlenecks. Based on this, Doris provides two primary tools to analyze both the plan and its execution performance. The following sections introduce these two key analysis and tuning tools:
Doris Explain
The execution plan describes the specific execution method and process of an SQL query. For instance, for an SQL query involving a join between two tables, the execution plan would show information about the access methods for these tables, the join method, and the order of operations.
Doris provides the Explain tool, which displays detailed information about the specific execution plan of an SQL query. By analyzing the output of the Explain plan, users can identify bottlenecks at the plan level and optimize the execution plan accordingly based on different scenarios.
Doris offers various Explain tools with different levels of granularity, such as Explain Verbose, Explain All Plan, Explain Memo Plan, and Explain Shape Plan, each designed to display the final physical plan, logical plans at various stages, the plan based on the cost optimization process, and the plan shape, respectively.
After obtaining the Explain output, business users or DBAs can analyze the current plan's performance bottlenecks. For example, they might find that filters were not pushed down to the base table, leading to an excessive amount of data being processed without prior filtering, which could cause performance issues.
In another scenario, during an inner equi-join between two tables, if the filter conditions on one side of the join are not derived to the other side, it may prevent pre-filtering of the derived side's table, also potentially leading to performance issues. Such bottlenecks can be identified and resolved by analyzing the output of Explain.
Refer to Plan Tuning for more detailed information.
Doris Profile
In addition, there are many commonly used system-level tuning tools that can assist in locating performance bottlenecks during execution. Tools like Linux's top, free, perf, sar, iostats, etc., can be used to observe the system's CPU, MEM, IO, and NETWORK status during SQL execution, further aiding in identifying performance bottlenecks.
Refer to the Profile documentation for more detailed information.
Performance Tuning Process
As mentioned above, performance tuning is a systematic process that requires a structured and phased methodology for systematic performance diagnosis and optimization.
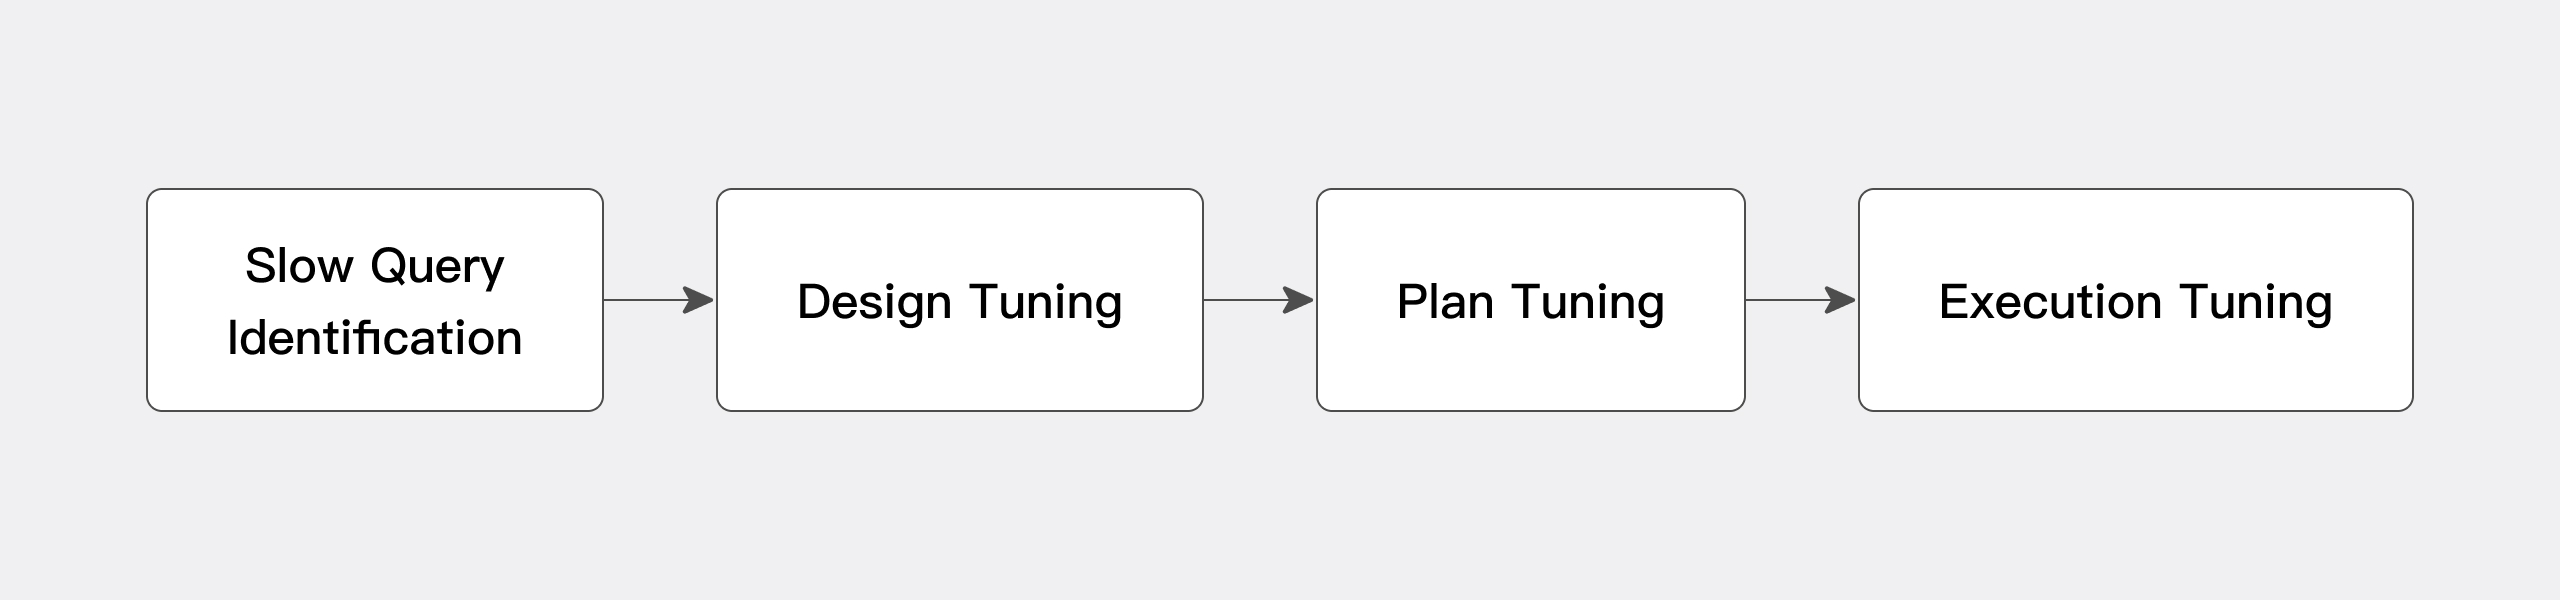
Doris recommends using the following tuning process, complemented by the aforementioned performance diagnostic and tuning tools, to systematically identify and resolve issues. The complete four-step tuning process is outlined below:
Step 1: Slow Query Identification Using Performance Diagnostic Tools
For business systems running on Doris, use the performance diagnostic tools mentioned earlier to identify slow SQL queries.
-
If Doris Manager is installed, it is recommended to use the Manager's monitoring and log pages for visual slow query identification.
-
If Manager is not installed, directly access the
fe.audit.logon the FE node. For the list of identified slow SQL queries, proceed with SQL-level tuning based on priority and severity.
Step 2: Schema Design and Tuning
After identifying specific slow SQL queries, prioritize checking and tuning the business Schema design to eliminate performance issues caused by unreasonable Schema design.
Schema design tuning can be broadly classified into three aspects:
-
Table-level Schema design tuning, such as the number of partitions and buckets, and field optimization.
-
Index design and tuning.
-
The use of specific optimization techniques, such as establishing Colocate Groups. The main goal is to eliminate performance issues caused by unreasonable Schema design or the underutilization of Doris's existing optimization capabilities.
For detailed tuning cases, refer to the Plan Tuning documentation.
Step 3: Plan Tuning
After reviewing and optimizing the business Schema, the main tuning work begins with plan tuning and execution tuning. As mentioned earlier, the primary task at this stage is to systematically analyze the execution plans of slow SQL queries using Doris's various levels of Explain tools to identify critical optimization points for targeted optimization.
-
For single-table queries and analysis scenarios, analyze the execution plan, check if partition pruning is working correctly, and explore the possibility of building materialized views for query acceleration.
-
For complex multi-table analysis scenarios, analyze whether statistical information is normal, evaluate Join Order rationality, and verify Runtime Filter planning. This helps locate specific performance bottlenecks. If unexpected situations arise, such as irrational Join Orders, observe the Explain results, manually specify Join Hints to bind execution plans, control Join order and Shuffle methods, and manipulate cost-based rewrites to achieve plan optimization.
-
For specific scenarios, accelerate queries using advanced Doris features such as asynchronous materialized view rewrites and SQL Cache.
For detailed tuning cases, refer to the Plan Tuning documentation.
When analyzing specific performance issues, it is recommended to prioritize using the Explain tool for execution plan analysis and tuning. Once plan issues are resolved, leverage Doris's execution tuning tool, Profile, for subsequent execution performance identification and tuning. Reversing the order of these tools can lead to inefficiencies in analysis and hinder rapid performance issue identification.
Step 4: Execution Tuning
At this stage, validate the effectiveness of previous tuning steps based on the actual SQL runtime performance or identify new bottlenecks in slow SQL queries. Then, follow the clues to find corresponding performance optimization solutions.
For multi-table analysis queries, analyze the Query Profile to check the rationality of Join order, the effectiveness of Runtime Filters, and the appropriateness of wait times. Often, execution tuning serves to corroborate the effectiveness of previous Schema and plan tuning. Additionally, the Query Profile can provide insights into BE or machine load issues, such as high CPU utilization or network latency. When tuning these issues, consider optimizing at the operating system level beyond Doris itself. For detailed tuning cases, refer to the Query Profile Analysis section.
Conclusion
Query tuning is a systematic process, and Doris provides users with tools across various dimensions to facilitate performance issue diagnosis, identification, analysis, and resolution from different levels. Business personnel and DBAs can better leverage Doris's powerful performance advantages and adapt to business scenarios by proficiently using these tools.
