Overview
Memory management is one of the most important components of Doris. During the operation of Doris, both load and query rely on a large number of memory operations. The quality of memory management directly affects the stability and performance of Doris.
As an OLAP database based on the MPP architecture, Apache Doris will stream and calculate between operators after loading data from disk to memory, and store the intermediate results of calculation in memory. This method reduces frequent disk I/O operations and makes full use of the parallel computing capabilities of multiple machines and multiple cores, which can show huge advantages in performance.
When facing complex calculations and large-scale operations with huge memory resource consumption, effective memory allocation, statistics, and control play a very critical role in the stability of the system - faster memory allocation speed will effectively improve query performance, and memory allocation, tracking and restriction can ensure that there is no memory hotspot, timely and accurately respond to insufficient memory and avoid OOM and query failure as much as possible. This series of mechanisms will significantly improve system stability; at the same time, more accurate memory statistics are also the basis for large queries to fall to disk.
Doris BE memory structure
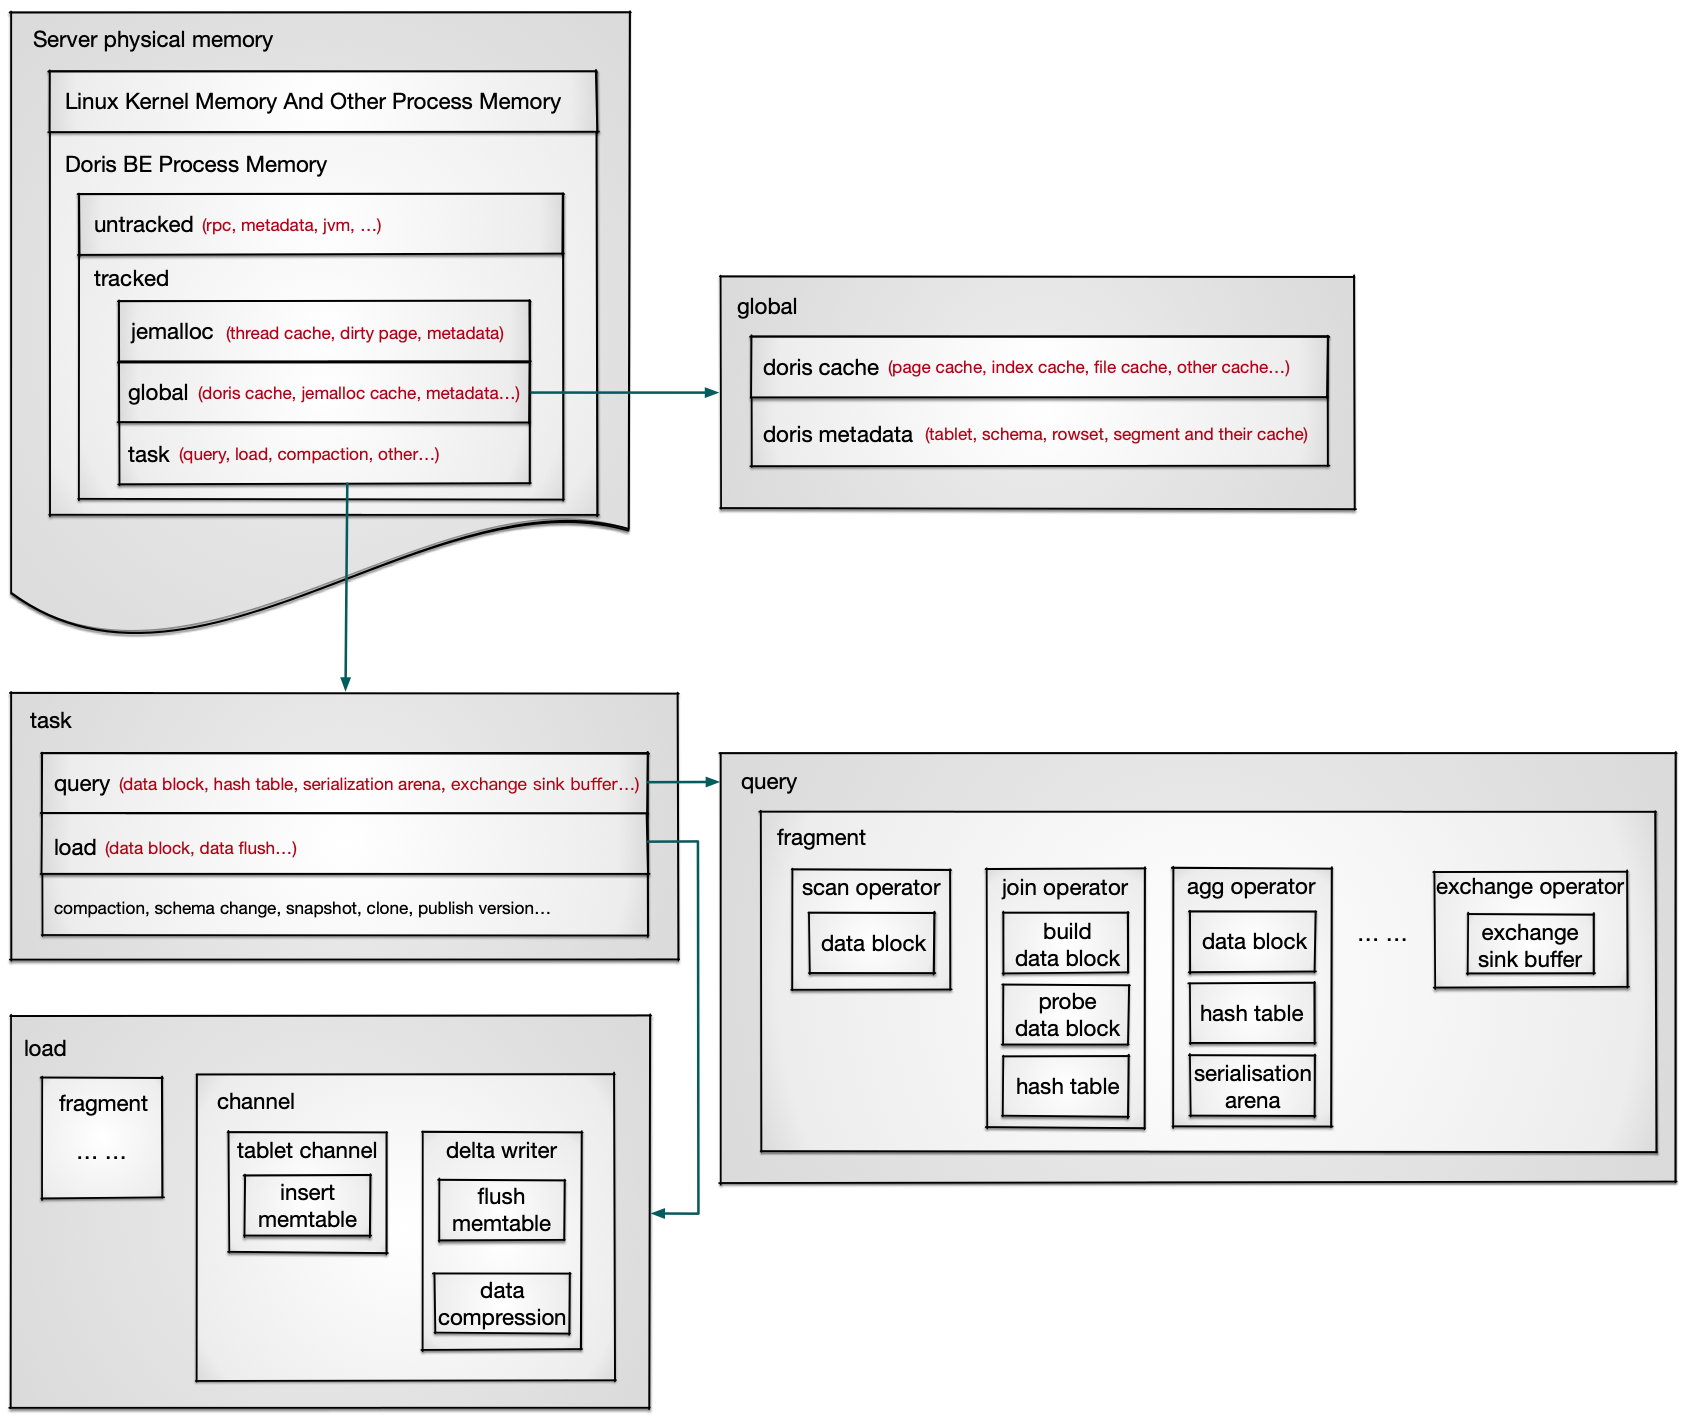
Server physical memory: The physical memory used by all processes on the server, MemTotal seen by `cat /proc/meminfo` or `free -h`.
    |
    |---> Linux Kernel Memory And Other Process Memory: Memory used by the Linux kernel and other processes.
    |
    |---> Doris BE Process Memory: The memory used by the Doris BE process. The upper limit is the server physical memory minus the memory used by the Linux kernel and other processes, or the memory size configured by the Cgroup.
            |
            |---> Untracked: Memory that is not tracked and managed, including RPC, JVM, some metadata, etc. JVM is used when accessing external tables or using Java UDF.
            |
            |---> tracked: Memory that is tracked and managed, allowing real-time viewing, automatic memory recycling, and size control through parameters.
                    |
                    |---> jemalloc: The cache and metadata managed by jemalloc support parameter control and are automatically recycled when memory is insufficient.
                    |
                    |---> global: Doris globally shared memory, mainly including cache and metadata.
                    |       |
                    |       |---> doris cache: Doris manages its own cache, which supports controlling capacity and elimination time through parameters separately, and automatically reclaims when memory is insufficient.
                    |       |
                    |       |---> doris metadata: metadata of data stored on BE, including a series of memory data structures such as data schema and their caches.
                    |
                    |---> Task: The memory used by the tasks executed on Doris, which is expected to be released after the task is completed, including query, load, compaction, etc.
                    |       |
                    |       |---> query: Memory used during the query. A query is split into multiple fragments and executed separately, connected by data shuffle.
                    |       |       |
                    |       |       |---> Fragment: A fragment is split into multiple operators and executed in the form of a pipeline.
                    |       |       |       |
                    |       |       |       |---> operator: includes memory data structures such as data block, hash table, arena, exchange sink buffer, etc.
                    |       |
                    |       |---> load: Memory used during data load. Data load includes two stages: fragment reading and channel writing data.
                    |       |       |
                    |       |       |---> fragment: Same as query fragment execution, stream load usually only has scan operator.
                    |       |       |
                    |       |       |---> channel: The tablet channel writes data to a temporary data structure called memtable, and then the delta writer compresses the data and writes it to the file.
Memory View
Doris BE uses Memory Tracker to record process memory usage, supports Web page viewing, and prints to BE logs when memory-related errors are reported, for memory analysis and troubleshooting.
Real-time Memory Statistics
Real-time memory statistics can be viewed through Doris BE's Web page http://{be_host}:{be_web_server_port}/mem_tracker, which displays the current memory size and peak memory size tracked by Memory Tracker of type=overview, including Query/Load/Compaction/Global, etc. be_web_server_port defaults to 8040.
Memory Tracker is divided into different types. Among the Memory Tracker of type=overview, except for process resident memory, process virtual memory, and sum of all trackers, the details of other Memory Trackers of type=overview can be viewed through http://{be_host}:{be_web_server_port}/mem_tracker?type=Lable.
Memory Tracker has the following properties:
- Label: the name of the Memory Tracker
- Current Consumption(Bytes): the current memory value, in B.
- Current Consumption(Normalize): the .G.M.K formatted output of the current memory value.
- Peak Consumption (Bytes): The peak memory value after the BE process is started, in units of B, and reset after the BE is restarted.
- Peak Consumption (Normalize): The .G.M.K formatted output of the peak memory value after the BE process is started, and reset after the BE is restarted.
- Parent Label: Used to indicate the parent-child relationship between two memory trackers. The memory recorded by the Child Tracker is a subset of the Parent Tracker. The memory recorded by different trackers with the same Parent may have an intersection.
For more information about Memory Tracker, refer to Memory Tracker.
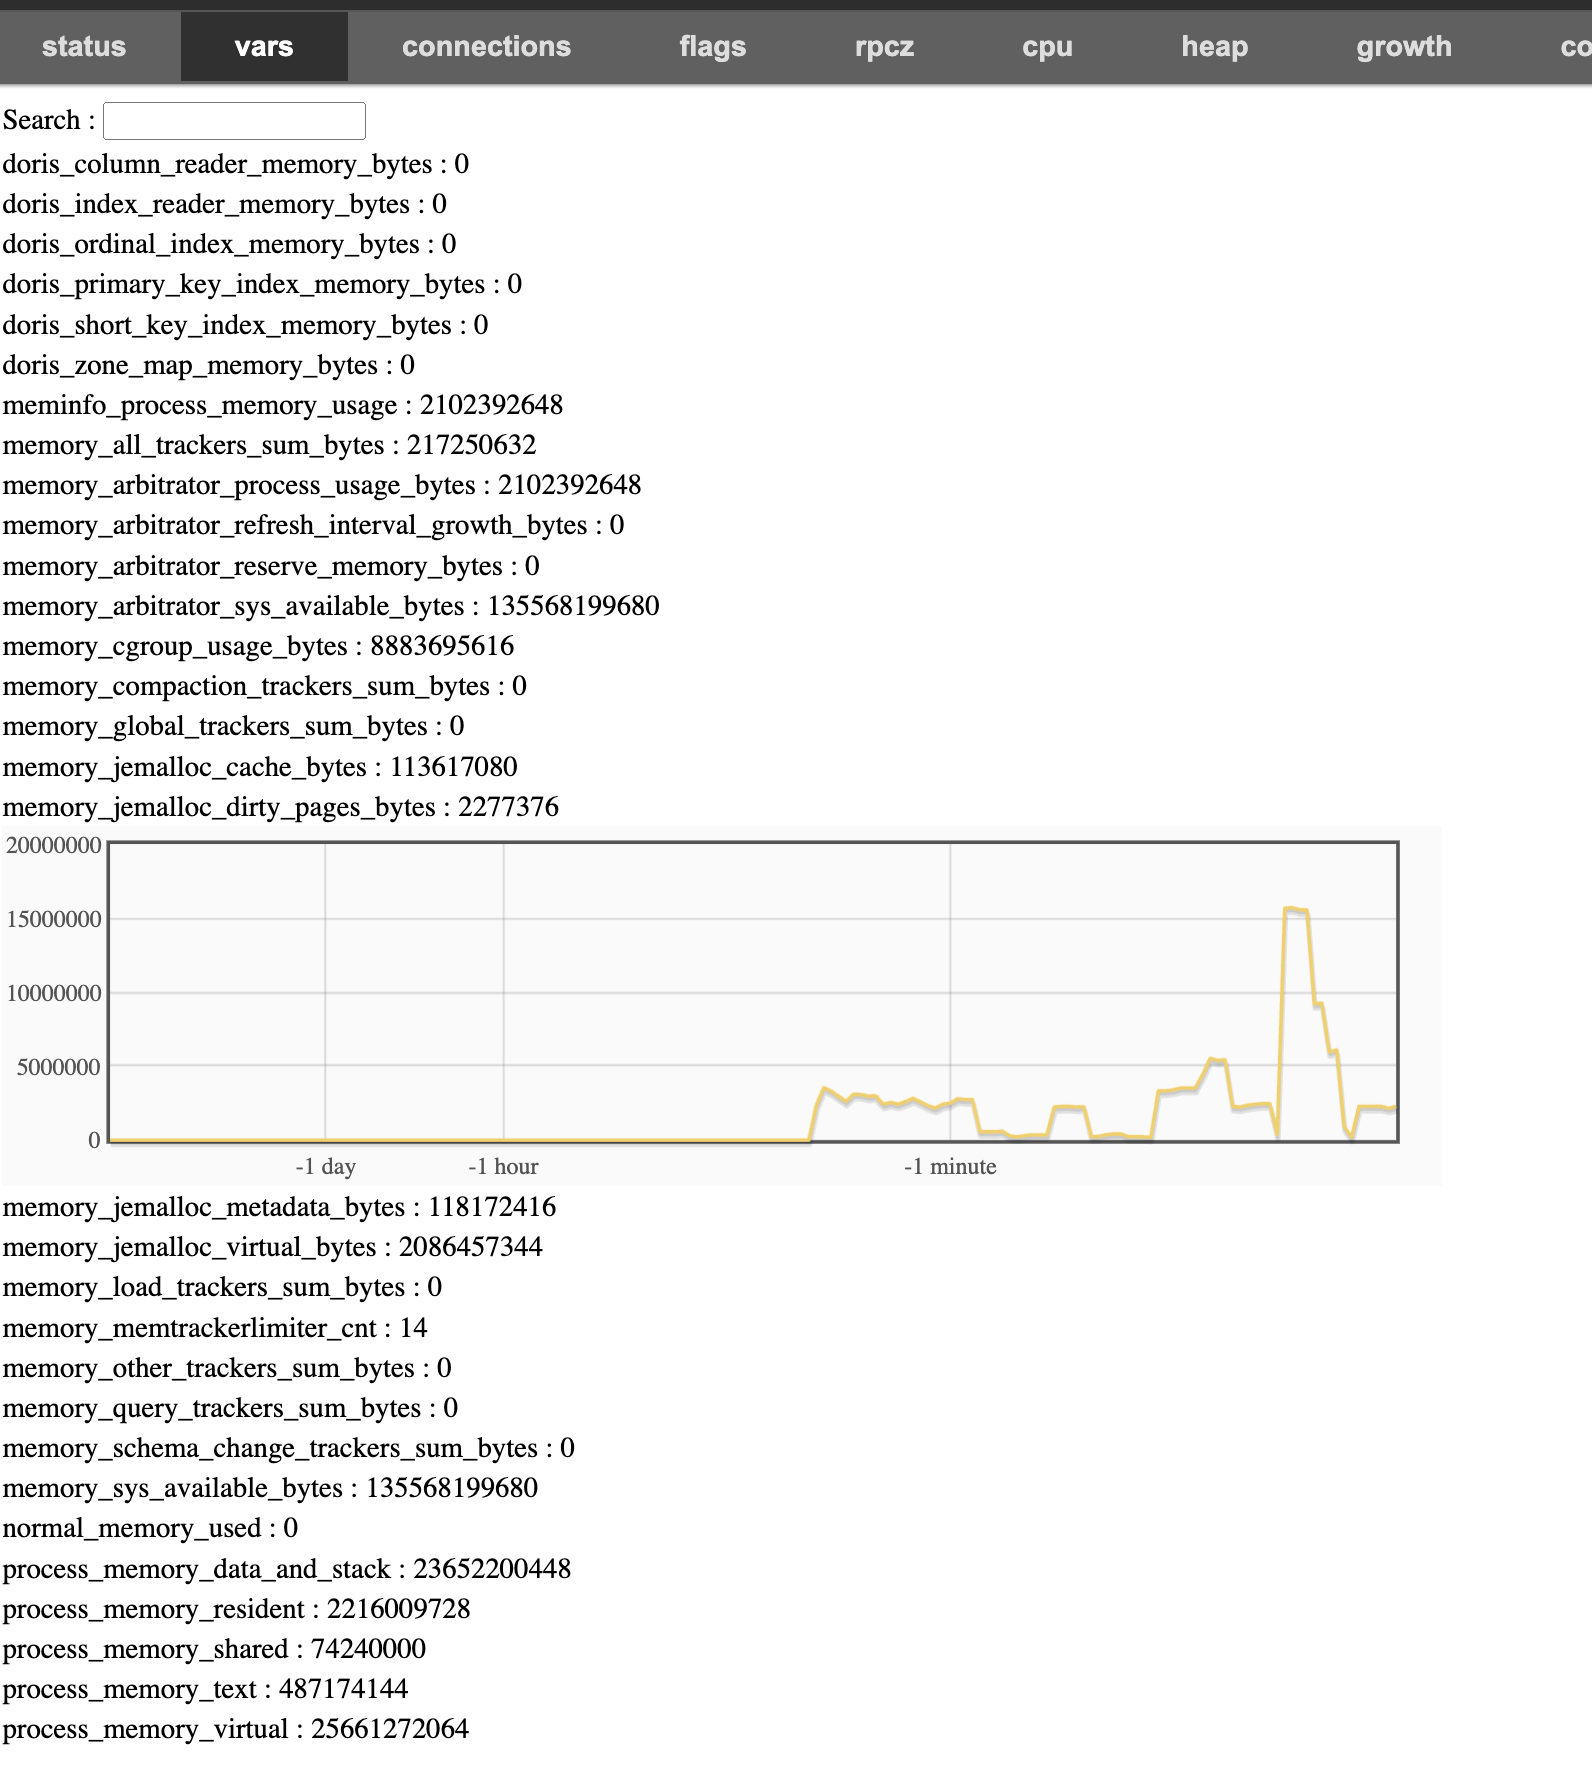
Historical memory statistics
Historical memory statistics can be viewed through Doris BE's Bvar page http://http://{be_host}:{brpc_port}/vars/*memory_*. Use the real-time memory statistics page http://{be_host}:{be_web_server_port}/mem_tracker to search for the Bvar page under the Memory Tracker Label to get the memory size change trend tracked by the corresponding Memory Tracker. brpc_port defaults to 8060.
When the error process memory exceeds the limit or the available memory is insufficient, you can find the Memory Tracker Summary in the be/log/be.INFO log, which contains all the Memory Trackers of Type=overview and Type=global, to help users analyze the memory status at that time. For details, please refer to Memory Log Analysis
Memory Analysis
Correspond the Memory Tracker of type=overview to each part of the memory under tracked in the above memory structure:
Doris BE Process Memory
    |
    |---> tracked: corresponds to `MemTrackerLimiter Label=sum of all trackers, Type=overview`, which is all the memory counted by the Memory Tracker, that is, the sum of the Current Consumption of other Memory Trackers with `type=overview` except `Label=process resident memory` and `Label=process virtual memory`.
            |
            |---> jemalloc
            |       |
            |       |---> jemalloc cache: corresponds to `MemTrackerLimiter Label=tc/jemalloc_cache, Type=overview`. The Jemalloc cache includes two parts: Dirty Page and Thread Cache.
            |       |
            |       |---> jemalloc metadata: Corresponding to `MemTrackerLimiter Label=tc/jemalloc_metadata, Type=overview`, Metadata of Jemalloc.
            |
            |---> global: corresponds to `MemTrackerLimiter Label=global, Type=overview`, including global Memory Trackers with the same life cycle and process such as Cache, metadata, and decompression. The web page `http://{be_host}:{be_web_server_port}/mem_tracker?type=global` displays all Memory Trackers of `type=global`.
            |
            |---> task
            |       |
            |       |---> query: corresponds to `MemTrackerLimiter Label=query, Type=overview`, which is the sum of Current Consumption of all Query Memory Trackers. The web page `http://{be_host}:{be_web_server_port}/mem_tracker?type=query` displays all Memory Trackers of `type=query`.
            |       |
            |       |---> load: corresponds to `MemTrackerLimiter Label=load, Type=overview`, the sum of Current Consumption of all Load Memory Trackers. The web page `http://{be_host}:{be_web_server_port}/mem_tracker?type=load` displays all Memory Trackers of `type=load`.
            |       |
            |       |---> reserved: corresponds to `MemTrackerLimiter Label=reserved_memory, Type=overview`. The reserved memory is used when query the Hash Table and other memory-intensive behaviors. Before query the Hash Table, the memory of the Hash Table to be constructed will be reserved from the Memory Tracker to ensure that subsequent memory requests can be met.
            |       |
            |       |---> compaction: corresponds to `MemTrackerLimiter Label=compaction, Type=overview`, the sum of Current Consumption of all Compaction Memory Trackers. The web page `http://{be_host}:{be_web_server_port}/mem_tracker?type=compaction` displays all Memory Trackers of `type=compaction`.
            |       |
            |       |---> schema_change: corresponds to `MemTrackerLimiter Label=schema_change, Type=overview`, the sum of Current Consumption of all Schema Change Memory Trackers. The web page `http://{be_host}:{be_web_server_port}/mem_tracker?type=schema_change` displays all Memory Trackers of `type=schema_change`.

            |       |
            |       |---> other: corresponds to `MemTrackerLimiter Label=other, Type=overview`, the total memory of other tasks except the above, such as EngineAlterTabletTask, EngineCloneTask, CloudEngineCalcDeleteBitmapTask, SnapshotManager, etc. The web page `http://{be_host}:{be_web_server_port}/mem_tracker?type=other` displays all Memory Trackers of `type=other`.
    |
    |---> Doris BE process physical memory, corresponding to `MemTrackerLimiter Label=process resident memory, Type=overview`, Current Consumption is taken from VmRSS in `/proc/self/status`, Peak Consumption is taken from VmHWM in `/proc/self/status`.
    |
    |---> Doris BE process virtual memory, corresponding to `MemTrackerLimiter Label=process virtual memory, Type=overview`, Current Consumption is taken from VmSize in `/proc/self/status`, and Peak Consumption is taken from VmPeak in `/proc/self/status`.
Analysis methods for each part of the memory in the above memory structure:
Memory problem FAQ
Refer to Memory problem FAQ to analyze common memory problems.
Memory control strategy
Refer to Memory Control Strategy for an introduction to memory allocation, monitoring, and recycling, which ensure the efficient and controllable memory of the Doris BE process.
